- Linear regression builds a model which establishes a relationship between features and targets.
- For simple linear regression, the model has two parameters w and b whose values are fit using training data. f(X) = wX + b
- Once a model’s parameters have been determined, the model can be used to make predictions on new data.
- Linear regression with one variable ==> univariate linear regression
- Linear function generates best fit line
To train the model:
You feed the training set (both the input features and the output targets) to your learning algorithm.
Then your supervised learning algorithm will produce some function (f). f is called the model.
Function takes a new input x and
Estimates or makes prediction (y hat) for y.
import numpy as np
import matplotlib.pyplot as plt

x_train = np.array([1.0, 2.0, 3.0,4.0, 5.0])
y_train = np.array([300.0, 500.0, 600.0, 700.0, 800.0])
m = x_train.shape[0]
# Try with different w and b values
w=160
b=100

def compute_model_output(x,w,b):
    m = x.shape[0]
    f_wb = np.zeros(m)
    for i in range(m):
        f_wb[i] = w*x[i] + b
    return f_wb

prediction = compute_model_output(x_train,w,b)
plt.plot(x_train, prediction, c="b", label = "Our Prediction")
plt.scatter(x_train, y_train, c="r", marker="x", label = "Actual Values")
plt.title("House Pricing")
plt.xlabel("Size")
plt.ylabel("Price")
plt.legend()
plt.show()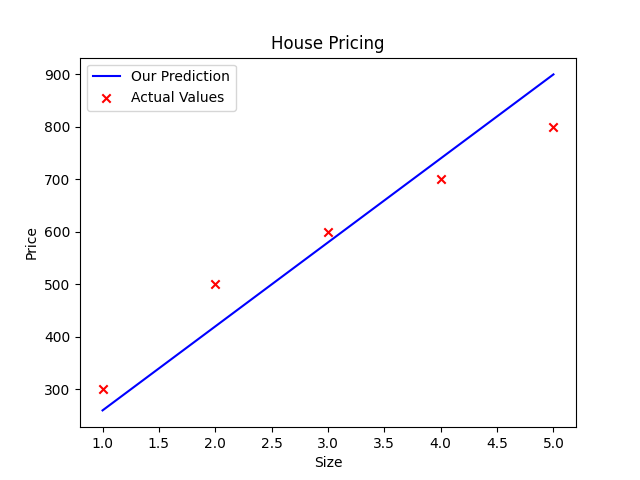
Here, we randomly gave the values w and b that fits the linear line. Now that we have a model, we can use it to make our original prediction : f(x) = 160 * x + 100
x_new = 3.5
f_wb_new = w* x_new + b
print(f"${f_wb_new:0f} thousands dolar")
# prediction : $660.000000 thousands dolar
How to find w and b?
The more fit w and b are found, the closer the prediction for y^ is to the true target.
How to measure how well a line fits the training data?
TO DO THAT, construct a cost function!